EnergyOnline
Reports

Reports

Mergers and Acquisitions


Generation market power in an interconnected electricity transmission system

An Analysis of Generation and Transmission Market Power in the Midwest Interconnect

Rajat K. Deb, Rafael Emmanuel A. Macatangay, and Sidart Deb

Abstract

The case recently brought against Entergy, a utility in the Midwest, is an example of a thorny antitrust issue in a restructured electricity industry: the detection and measurement of market power. In the presence of transmission congestion, the relevant geographic market changes hourly, and as a result, the traditional measures of market power, such as market share and the Hirshman-Herfindahl Index, are inappropriate. Moreover, the simplistic application of standard economics models, such as a Cournot with a competitive fringe, has an unhealthy bias in favor of finding market power. A proper analysis of whether or not Entergy lacks market power has to include a rigorous model of the interconnected transmission systems in and around the Midwest, their corresponding locational and temporal markets, as well as the technical and commercial factors influencing price discovery. UPLAN, a proprietary engineering economy model of the North American power system, is deployed in a simulation of the Midwest Interconnect in order to produce a legal determination on Entergy’s potential exercise of market power.

Outline

1.         The Market Power Case Against Entergy

2.         Generation Market Power in an Interconnected Transmission System

3.         Modeling Power Markets in the Entergy Area and the Midwest Interconnect

4.         A Possible Competitive Concern

5.         Summary

Appendix A, The UPLAN Modeling System

Appendix B, A Simulation of the Midwest Interconnect


1.          The Market Power Case Against Entergy

            On 30th December 1999, Entergy Services, Inc., on behalf of the Entergy Operating Companies (collectively, “Entergy”), submitted to the Federal Energy Regulatory Commission (FERC) a market power study concluding that Entergy lacks market power in all relevant markets. Entergy had used the study to support the continuation of market-based rates for itself and its associates. On 19th January 2000, Aquila Energy Marketing Corporation (“Aquila”) protested Entergy’s filing of no market power. On 16th March 2000, FERC announced that it was to consider all relevant evidence in relation to whether or not Entergy lacks market power and thus should be allowed to charge market-based rates. On 18th April 2000, Aquila submitted a supplemental protest[1] incorporating, among others, the market power analysis described in this paper. 

            The market power case against Entergy is timely, relevant, and interesting. In November 2001, FERC had ruled that Entergy possessed the capability to exercise market power in its area, and had ordered it to charge cost-based rates for power sold without long-term contracts.[2] However, on 10th January 2002, 12 power generators have asked FERC to stop Entergy from allegedly charging “unjust, unreasonable, and unduly discriminatory rates” for energy imbalances resulting from generation under-deliveries. They claim that FERC did not go far enough to address market power problems in Entergy’s system.[3]

In general, the restructuring of the electricity industry in the U.S. was motivated largely by a belief that markets and competition are superior to command-and-control directives. However, the possible exercise of market power by generators, with the perception of huge wealth transfers from consumers to power companies, has been quite controversial not only in Entergy but also in two restructured power markets: PJM[4] and California.[5] As a consequence, the antitrust of electric power generation, a non-existent field of study not too long ago, has become increasingly important in law, economics, and engineering. Market power, tacit collusion, and related antitrust issues are now key policy concerns in many restructured power markets.[6]

            Perhaps most importantly, novel approaches are needed for detecting and measuring generation market power. In the presence of transmission congestion, which occurs in the Midwest Interconnect and its neighboring grids, the geographic market changes every hour, and as a consequence, the traditional measures of market power, such as market share and the Hirshman-Herfindahl Index (HHI), fail to capture the rapid and radical changes in competition across space and time. A simplistic application of standard economics models, such as a Cournot with a competitive fringe, tends to find more market power than they should. The literature does not help much: most of the specialist research on generation market power excludes the effects of the transmission network,[7] and in the papers that do recognize transmission effects, the network model deployed in the analysis ignores several engineering and economic variables.[8]Thus, a proper analysis of the market power case against Entergy has to include a model of the interconnected transmission systems in and around the Midwest, their corresponding locational and temporal markets, as well as the technical and commercial factors influencing the discovery of market prices.

2.         Generation Market Power in an Interconnected Transmission System

            A useful definition of market power is the ability of a generation company, using one or more of its plants, to increase market price profitably over a significant period of time.[9] The company ceases to be a price-taker. The game it is playing is static, a one-shot event, and its strategy is rational only within a single point in time. The company makes a unilateral decision to withhold capacity, to raise price bids, or to do both. Its aim is to increase the slope of the market supply curve and thus to raise the market price. It then is able to profit handsomely from the supply it has not withheld. The clues for detecting market power in generation are well established. [10] Low demand elasticity produces a weak consumer response to a market price increase. Large demand exhausts fringe capacity, and the dominant firm is a monopoly over the large residual demand it faces. A firm can raise the price bids of its marginal, price-setting plants in order to benefit its infra-marginal ones. Low supply elasticity allows a firm to induce a market price rise without the concern that, in response, its rivals might raise their output. Binding transmission constraints divide the grid into isolated pockets and thus allows favorably located generating plants to wield local market power. The submission of bid curves that vary significantly across similar hours and market conditions is another indicator. Finally, emission allowances also affect market power. If and when a generator reaches its emission limit, assuming it is operating below capacity, then its production is constrained.[11]

            As mentioned above, market share and HHI are unable to capture the dynamics of space-time competition in restructured power markets. Transmission constraints alter the scope of the geographic market and render a market share calculation meaningless. A generator could strategically induce congestion in order to blockade the entry of imports and thus to capture the market solely for itself.[12] Indeed the FERC criteria for market-based rates, the market share “safe harbor” of 20% and related HHI measures, were deeply flawed and never proven in power markets.[13] Market shares and HHIs, therefore, are useful only as an initial screening device and definitely not conclusive. To acquire meaning and depth, they have to be combined with information on transmission congestion.

A typical approach to market power analysis is to utilize a computer simulation model.[14] However, a model is only as good as the theory underlying it, and what is needed is a scientific body of knowledge guiding its creation and implementation. The field of economics fills this need. But a simplistic application of economics models, such as single firm behavior or Cournot with a competitive fringe, tends to have a bias in favor of finding an anticompetitive effect. A forecast of market behavior has to include, among many other factors, demand uncertainty, the cost of withholding capacity, entry, information uncertainty, contracts, and market rules.[15]

            Indeed market price is determined by a confluence of several diverse events and factors (see Figure 1). A decision by one plant could affect and be affected by commercial and physical conditions both near and far. Supply and demand, with all their nuances, is just another set of factors. All possible market design loopholes and legal inconsistencies are exploited for profit. The status-quo pattern of transmission constraints is usually beneficial to some generation and transmission owners but detrimental to others. In California, the potential for earning capacity payments in the ancillary service markets is a powerful incentive to withdraw capacity from the energy market, in which payments are purely on energy. Expectations of drought and unfavorable changes in weather patterns increase the scarcity value of water and worsen any strategic behavior exercised by a hydro unit. In short, many interacting factors are at work, [16] and any proper analysis of generation market power quickly becomes intractable.


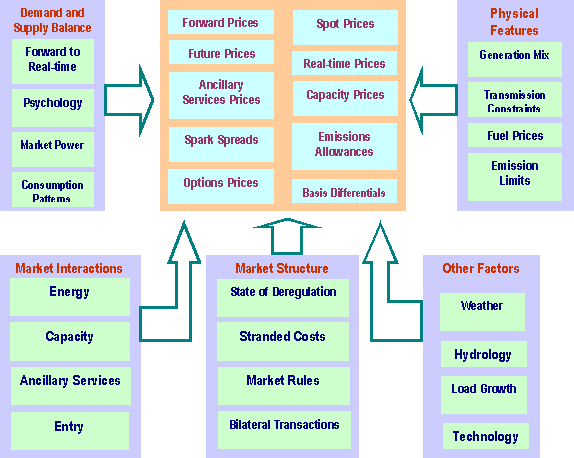
Figure 1. Price Discovery in Restructured Electricity Markets

Specialist models, such as UPLAN, our proprietary engineering economy representation of the Northern American electric power system (see Appendix A), can do a proper job of capturing the key commercial, physical, regulatory, and climactic factors driving market outcomes.[17] Thus, a methodology that appears to present itself points beyond market shares, HHI, and the usual misuse of economics models. After defining the relevant product and geographic market, market shares and HHIs could be calculated. A dynamic analysis is then performed in order to account for

  • The time-varying nature of the geographic market;
  • The relevant economic capacity defined as the actual generation during the pricing period;
  • The frequency of market dominance in sales;
  • The duration of market dominance; and
  • The structure of bids.[18]

            Finding the relevant geographic market (RGM) is accomplished through a series of steps. The first step is to identify, in the service territory, all the generation of the company under investigation. The second step is to identify, in the interconnected region, all other generation that could sell power into the service territory. The third step is to determine the nodal spot prices (NSPs) in the interconnected region, and then to define the zones based on the correlation of the NSPs. Finally, the zone containing the company under investigation becomes the RGM. For example, in the presence of transmission constraints, the NSPs are different, and the NSP prevailing in each zone defines the RGM for the time period under scrutiny (see Figure 2).[19]


 Figure 2. Time-varying Relevant Geographic Markets

 3.         Modeling Power Markets in the Entergy Area and the Midwest Interconnect

            The Entergy Corporation has power generation and distribution facilities and related services internationally. In 2000, it had revenues of $10B, assets of $25.5B, sales of 103M MWh, and more than 30 GW of generation capacity. As of 31st December 2000, it provides retail services to 2.6M customers in various parts of Arkansas, Texas, Louisiana, Mississippi, and New Orleans.[20] The market power analysis of Entergy covers the Midwest Interconnect (see Appendix B), which is composed of five regions of the North America Electricity Reliability Council (NERC[21]): the Mid-continent Area Power Pool (MAPP), the Southwest Power Pool (SPP), the Mid-America Interconnected Network (MAIN), the East Central Area Reliability Coordination Agreement (ECAR), and the Southeastern Electric Reliability Council (SERC). The Midwest Interconnect, where a non-trivial amount of energy is exchanged, covers all the North American power pools that significantly export to, and import from, the Entergy region (see Figure 3).

            A simulation is performed to calculate hourly market clearing prices (MCPs) in the zones of the Midwest Interconnect for a base year as well as for a forecast year of 2001 (the antitrust case was in 2000). The aim is to determine whether or not prices diverge significantly between one zone and another. Price divergence indicates transmission congestion and the isolation of zonal markets, and the law of one price does not hold.[22] In the simulation, all transmission wheeling charges and market access fees are set to zero. As a consequence, the calculated MCPs are a result of transmission congestion only and do not reflect region-specific tariffs. The antitrust implication of transmission congestion is that a generator isolated from the pressures of competition in other zones can afford to influence MCPs in its own zone for a significant period of time.


Figure 3. The Midwest Interconnect

            In the simulation, the Midwest Interconnect is divided in eight zones (see Table 1). Each zone has several demand areas generally corresponding to service territories of individual utilities. In a demand area, a node (junction, or bus) refers to a location where electricity is either injected by a generator or withdrawn by a customer, or where there is a transmission junction (bus), such as a major sub-station. For each demand area, a load forecast is made, a chronological load shape is created, and nodes are assigned for electricity withdrawal.[23] Peak demand ranges from a low of 18,155 MW in zone 8 to a high of 95,451 MW in zone 2 (see Appendix Table B.2 for other zones).

For supply, total generation capacity is 471,312 MW, 48% of which is coal (see Figure 4). Each generator is assigned an injection node on the grid. Natural gas and other fuel prices are based on New York Mercantile Exchange (NYMEX) futures contracts, various hub delivery indices, and independently obtained information on fuel availability. For the transmission system, lines rated 161 KV and above are represented individually in order to characterize the major transmission paths linking demand to supply areas. High capacity 345, 500, and 765 KV transmission systems transport large blocks of energy from one interconnected area to another. Simulation models for the market, multi-area production costing, and optimal load flow are solved simultaneously in order to generate a production schedule for each generator in each hour, in a manner that meets demand bids, clears the market, respects transmission constraints, and minimizes the sum of start-up, no-load, and incremental energy costs.

Table 1. Eight Zones in the Midwest Interconnect Simulation

Zone

Region

Description

1

MAIN

Wisconsin, Northern and Central Illinois, Eastern Missouri

2

ECAR

Michigan, Indiana, Ohio, Eastern Kentucky, Western Pennsylvania, West Virginia

3

MAPP

Canada, the Dakotas, Nebraska, Minnesota

4

SPP

Oklahoma, Missouri, Kansas

5

Entergy region

Arkansas, Louisiana, Western Mississippi, East Texas

6

Southeast

Florida’s panhandle region, Georgia, the Carolinas

7


Tennessee Valley Authority, Alabama, Eastern Mississippi

8

Virginia


Figure 4. Generation Resources in the 1999 Simulation of the Midwest Interconnect

4.         A Possible Competitive Concern

            On average, peak and off-peak prices in Entergy are persistently different to those in SPP and the Southeast (see Figures 5 and 6). Sustained price divergence indicates that the law of one price does not hold, and that transmission constraints prevent generators in one zonal market from competing with those in others. Indeed peak and off-peak average prices in Entergy are typically greater than those in SPP and the Southeast (again see Figures 5 and 6). Prices in the Southeast exceed those in Entergy only in the summer months of July and August.

            Minimum load levels served in each area might have caused the differences in off-peak prices between Entergy and the Southeast. High load transmission constraints, based on a 2,200 MW transfer limit, might have caused the differences in peak prices between Entergy and the Southeast. SPP and Southeast transfer limits are operating constraints determined by network reliability reservations and do not reflect contract reductions based on line reservations. Reductions in line reservation constraints would only increase congestion, and with it, the price differences.

Figure 5. Simulated Monthly Differences Between the Entergy Area and SPP Average Peak and Off-peak Prices


Figure 6. Simulated Monthly Differences Between the Entergy Area and Southeast Average Peak and Off-peak Prices

            Price differences seem rather insignificant between Entergy and MAIN, although on average, peak prices in MAIN exceed those of Entergy during the summer months of July and August (see Figure 7). Price divergence may be slight and, compared to those in SPP and the Southeast, in the opposite direction, but nevertheless indicates the presence of transmission constraints, which typically have an anti-competitive effect.


Figure 7. Simulated Monthly Differences Between the Entergy Area and MAIN Average Peak and Off-peak Prices

            A stylized measure of market share can be developed for the players in the Entergy region (see Figure 8). The concentration of supply is calculated in terms of the percentage ownership of energy either generated in or imported into the Entergy region. Entergy has the largest share, 53%, and imports, at 25%, are a far second. Each of the remaining players has a share of eight percent or less, and quite a few have vanishingly small shares. Assuming competitive imports, the HHI is 2,897, implying a highly concentrated market (in fact, assuming monopoly imports, it is worse at 3,490).

            What needs to be done is to bring the analysis on transmission congestion in Figures 5 to 7 to bear upon that on market share and its implied HHIs in Figure 8. During certain periods of time, prices in Entergy diverge from those in surrounding areas. Transmission capacity is therefore constrained. “Inside the constraint,” however, Entergy owns a very large share of energy production. An increase in wholesale prices could be very profitable for Entergy because it can earn a higher margin than otherwise on a substantial base of output. Moreover, in the presence of binding transmission constraints, imports cannot readily expand to soften the increase in bid prices. Indeed wholesale customers “inside the constraint” are unable to turn to local, non-Entergy generators who collectively have, at most, a quarter of supply.[24] As a result, Entergy’s customers can rely neither on imports nor on Entergy’s rivals as instruments of contestability. In the words of Janusz A. Ordover and Robert D. Willig, two noted economists who used these results in their testimony on the case, “Entergy’s market share figures – coupled with the effective constraints on the interfaces – signal a possible competitive concern: namely that at certain times, Entergy could profitably exercise market power in these generation markets.”[25]

Figure 8. Annual Percent Ownership of Energy Generated in the Entergy Area

5.         Summary

            The detection and measurement of Entergy’s market power in the Midwest Interconnect requires an engineering economy model capable of capturing the commercial, physical, regulatory, and climactic factors driving market outcomes. A modeling approach that ignores the network, or has an unsophisticated representation of the network and its links with the various power markets, is potentially misleading. The Midwest Interconnect covers a substantial part of North America. In its region, Entergy is isolated by transmission constraints during certain times and owns more than half of annual energy production. Imports provide only a quarter of supply, and given the size of demand, the capacity of Entergy’s rivals is quickly exhausted. Binding transmission constraints and Entergy’s non-trivial energy production share point to the concern that Entergy has an incentive and the ability to exercise market power.

Appendix A. The UPLAN Modeling System

            The UPLAN System is a large group of electric and natural gas utility planning and operating system software. It was developed by LCG Consulting[26] over the last 17 years, and continues to evolve. The UPLAN-E System is a version customized specifically for restructured power markets. In essence, it is a multi-commodity, multi-area optimal power flow model of electricity markets. In this article, it is configured for North America (see Figure A.1). UPLAN-E has three main components: the Network Power Model, the Volatility Model, and the Merchant Plant Model (see Figure A.2). The Network Power Model has two main components, an Optimal Power Flow Model, which is a detailed AC representation of the transmission system, and an Electricity Market Model, which reflects generator and load bidding behavior in forward and real-time markets for energy and ancillary service commodities. It implements an hourly chronological dispatch with Monte Carlo modeling of uncertainty associated with generators and loads. The Network Power Model calculates congestion costs and MCPs across space and time.


Figure A.1 The Ten Regions of the North American Electric Reliability Council (NERC)

            The Volatility Model allows the calculation of the real option value of a generating plant for a distribution of market outcomes. It is used for the assessment of asset values, bid and hedging strategies, and risk. The Volatility Model performs a systematic analysis of price volatility caused by uncertainty in fundamental market drivers, such as fuel prices, hydro conditions, demand, generator and transmission outages, entry, and other crucial variables. Finally, the Merchant Plant Model is a dynamic model of generator entry.[27] Generator investment decisions are endogenously determined by the profit a potential entrant is expected to earn.

 Figure A.2 Schematic of UPLAN-E

            UPLAN-E employs a rational expectations approach to the behavior of players: solutions are obtained iteratively, and as a result, the information set of each player consists of the underlying determinants of market outcomes. As a whole, therefore, UPLAN-E is a mathematical replica of a restructured power market.[28]

Appendix B. Simulation of the Midwest Interconnect

            Power flow limits on significant transmission interfaces between one area and another in the Midwest Interconnect (see Table B.1) are modeled to produce security-constrained solutions. Forecasts of hourly load, including distribution losses (see Table B.2), are aggregated in order to produce hourly load profiles[29] that are required to determine transmission flows. Inputs for plants are from our proprietary North American database as well as from Form EIA-411 of NERC. Natural gas prices are lowest at $2.18/mmBTU in Oklahoma and highest at $2.77/mmBTU in Tennessee (see Figure B.1). Most coal prices are from $1.23/mmBTU to $1.55/mmBTU (see Figure B.2). Oil prices are lowest at $2.62/mmBTU in Oklahoma and highest at $3.32/mmBTU in Tennessee (see Figure B.3). Most nuclear prices are $0.6/mmBTU (see Figure B.4).

Table B.1 Interface Capacities in the Midwest Interconnect


Maximum Flow, MW

Interface

East/South

West/North

VACAR to Southern Company

3,073

2,300

MAPP to MAIN

1,783

750

ECAR to MAIN

2,600

6,000

ECAR to SERC

400

2,718

East Missouri to South Central Illinois

1,700

1,500

South Central Illinois to TVA

4,500

788

South Central Illinois to North Illinois

1,400

2,000

Montana to SPP

200

200

Canada to SPP

1,575

750

Western to Eastern MAPP

4,000

3,500

TVA to Southern Company

922

1,700

SPP to MAPP

350

2,040

SPP to MAIN

650

2,579

ECAR to VACAR

1,812

4,000

SPP to Entergy

1,900

1,500

Entergy to TVA

2,600

2,861

Entergy to MAIN

2,447

3,000

Entergy to Southern Company

2,228

2,800

 Table B.2 Demand and Energy Forecast for the Midwest Interconnect  

Zone

Energy GWh

Peak MW

1

239,248

46,041

2

546,415

95,451

3

187,141

34,788

4

135,535

27,687

5

159,221

31,030

6

328,171

67,457

7

267,303

48,270

8

100,681

18,155


Figure B.1 1999 Annual Average Natural Gas Prices in $/mmBTU in the Midwest Interconnect


Figure B.2 1999 Coal Prices in $/mmBTU in the Midwest Interconnect


Figure B.3 1999 Oil Prices in $/mmBTU in the Midwest Interconnect


Figure B.4 1999 Nuclear Prices in $/mmBTU in the Midwest Interconnect


Copyright © 2024 LCG Consulting. All rights reserved. Terms and Copyright